See Where You're Winning. Fix Where You're Not.
Pipeline metrics, conversion analytics, and LO performance reports that answer the questions spreadsheets can't — in real time.
Why Loan Officers Love This
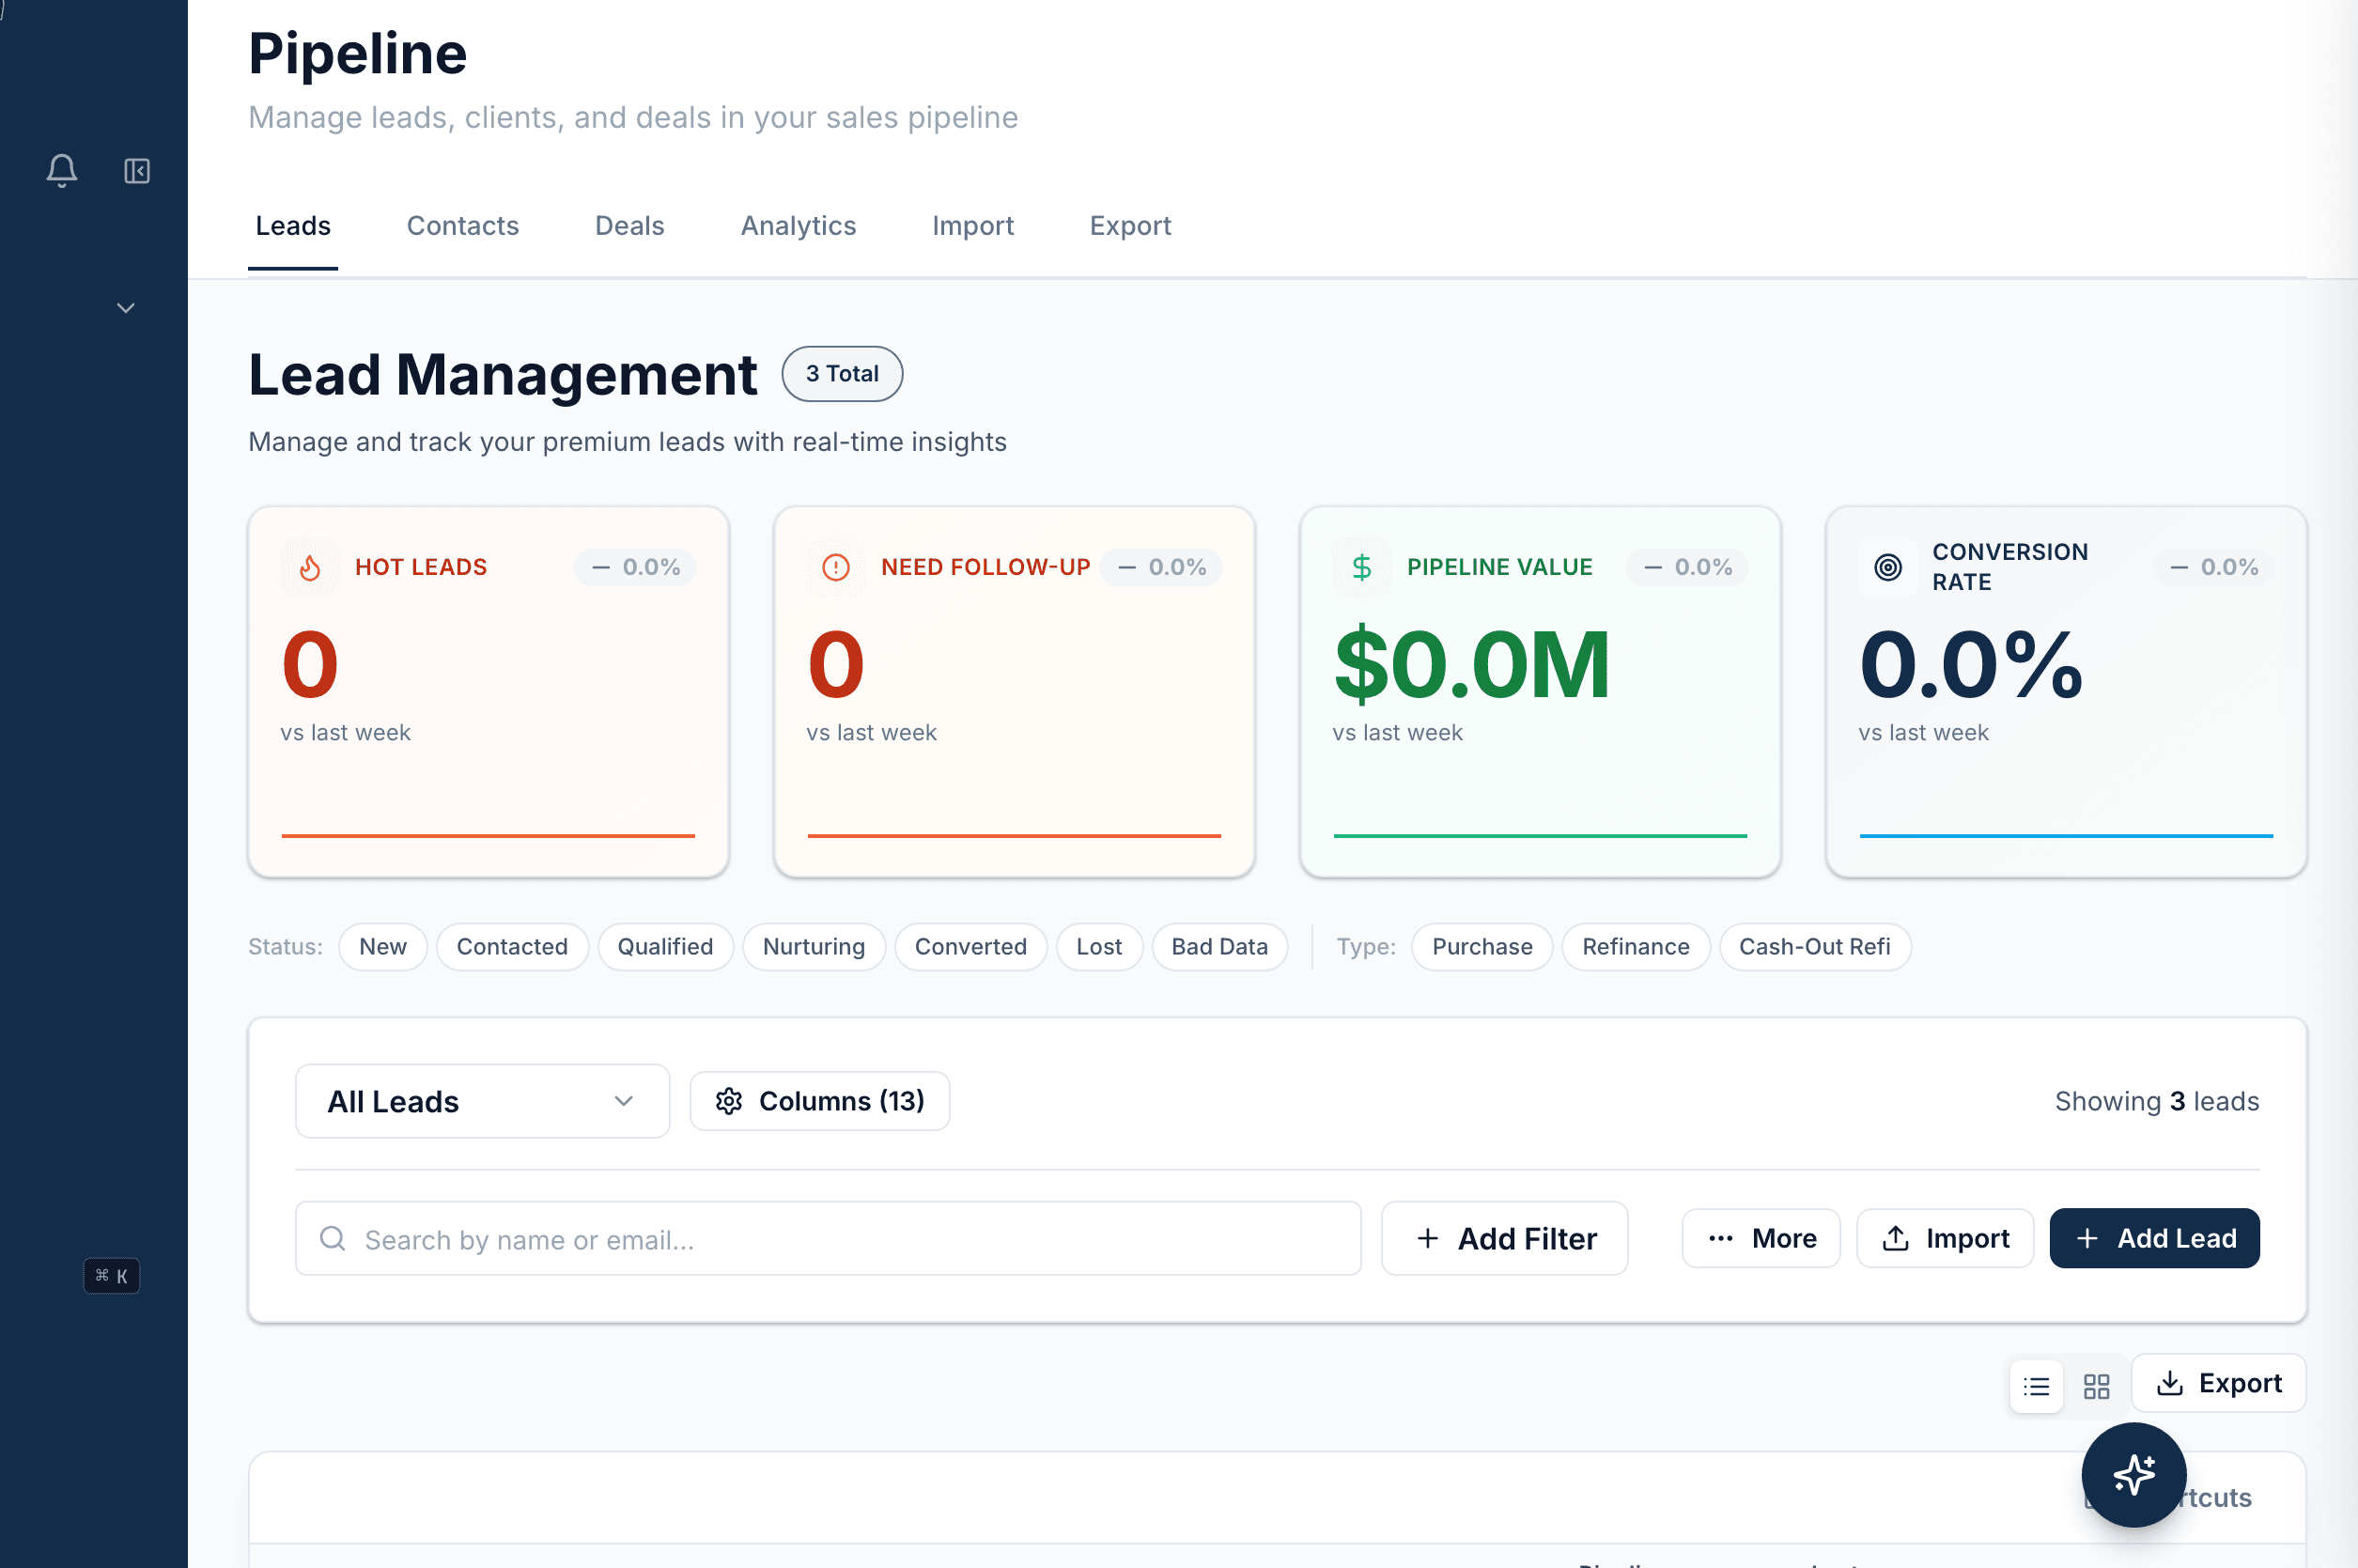
Pipeline Analytics
Real-time pipeline value by stage, average time in stage, and conversion rates between steps. See bottlenecks before they cost you deals.
Conversion Tracking
Lead to app, app to approval, approval to close — see your conversion rates at every stage and identify where deals are falling out.
Lead Source ROI
Track which lead sources produce the most funded loans — not just the most leads. Know where to spend your marketing dollars.
LO Performance Reports
Compare call volume, response time, close rate, and pipeline value across your team. Identify top performers and coaching opportunities.
How Loan Officers Use This
Weekly Branch Report
Every Monday, pull the branch report: $4.2M in pipeline, 23 active deals, 8 closing this month. Breakdown by LO with conversion rates. Email it to ownership in 2 clicks.
Lead Source Audit
Spending $2K/month on Zillow leads? The ROI report shows 12 of 80 leads funded. Compare to LendingTree at $1.5K with 18 funded. Data-driven budget decisions.
Coaching with Data
LO has a 40% app-to-close rate vs. team average of 65%. Drill down: they're losing deals at underwriting. Now you know exactly what to coach on.
Ready to See It in Action?
Book a personalized demo and we'll show you exactly how this works with your pipeline.
Book a Demo