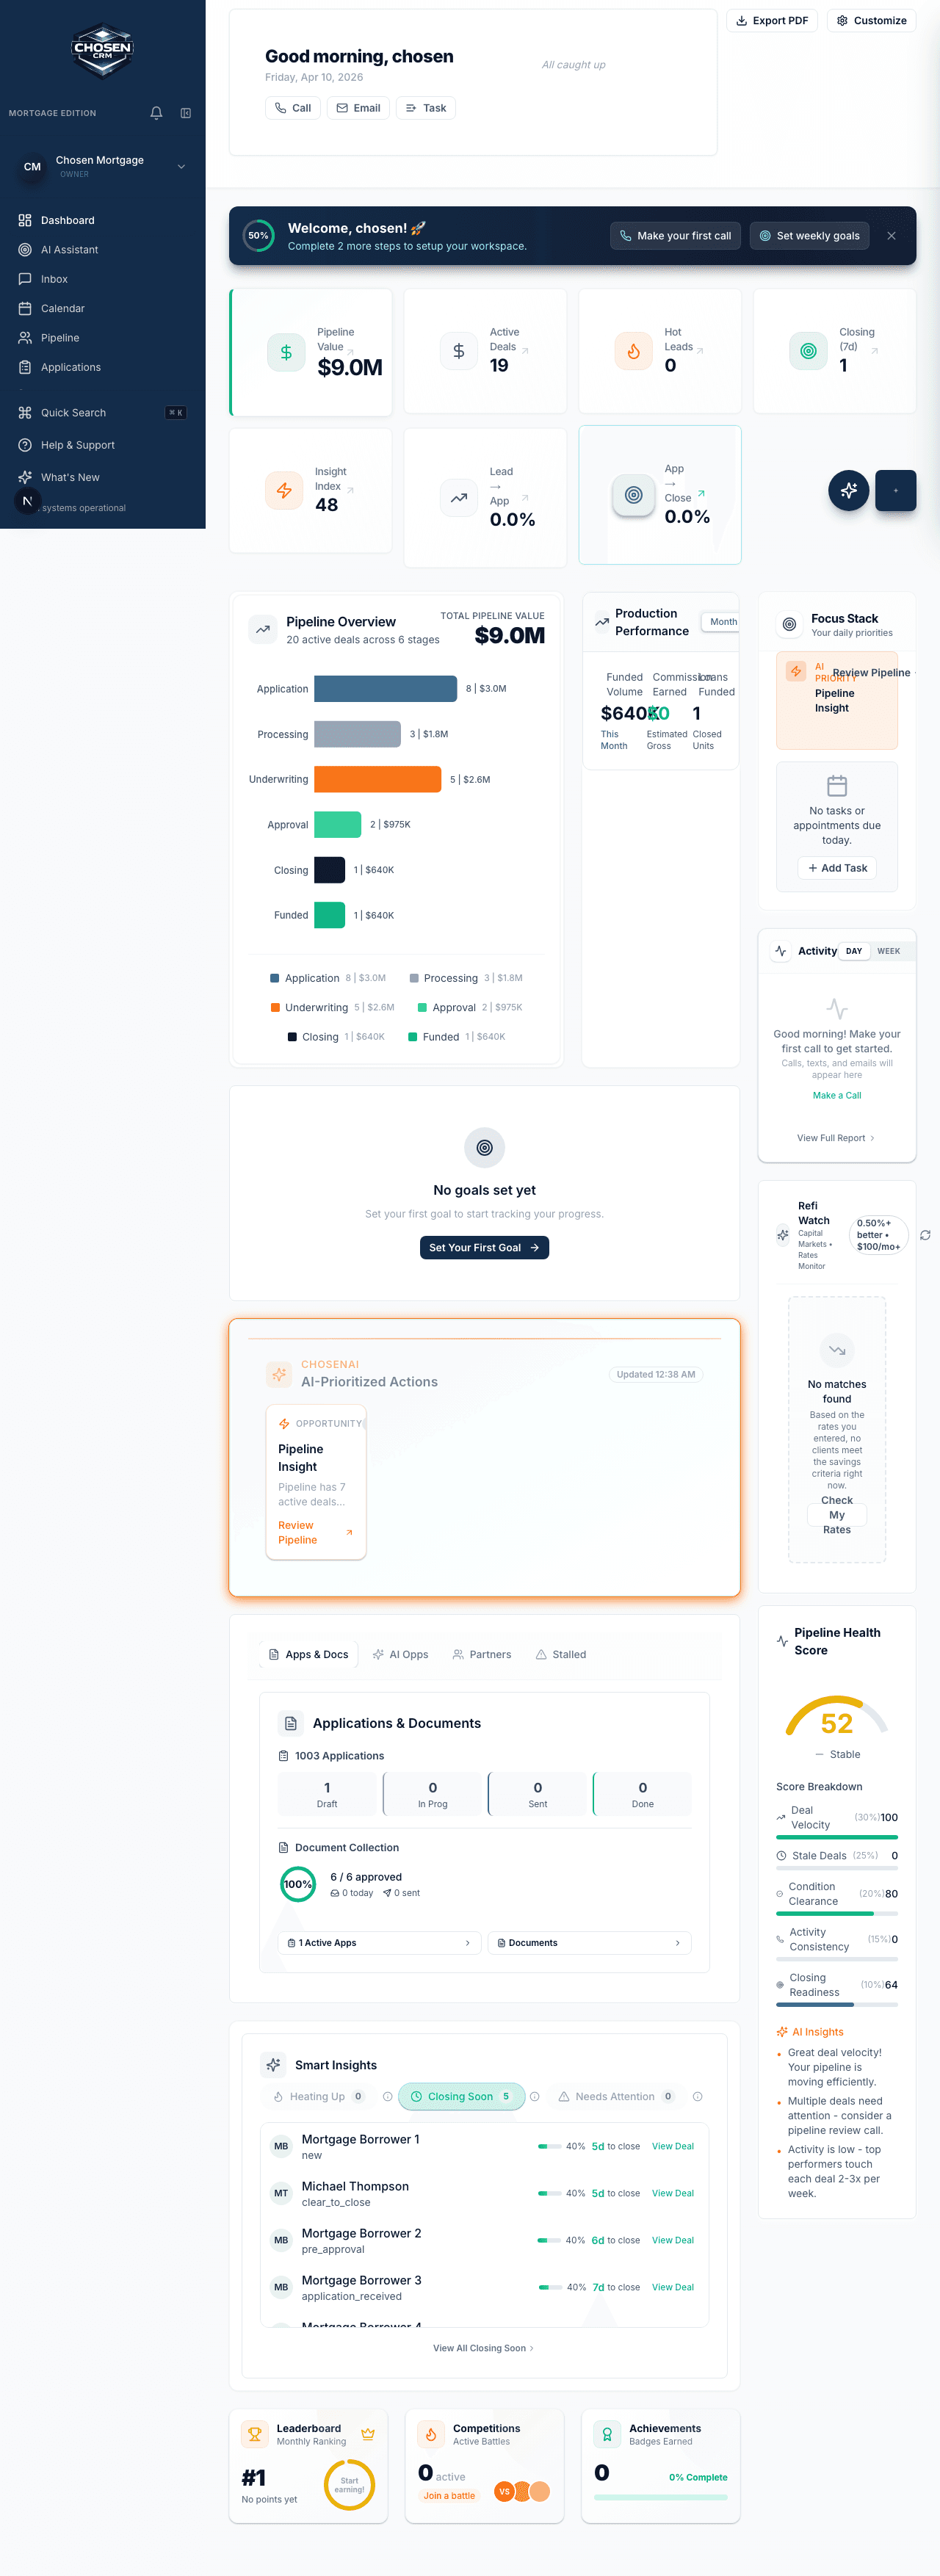
See What's Working, Who's Producing, and Where Deals Stall
Pipeline reports, activity tracking, revenue forecasting, and team performance dashboards that show you the truth about your business. No vanity metrics — just the numbers that drive decisions.
Most dashboards measure motion. The only numbers worth a manager's time are the ones that predict the close.
Stage-by-stage
Conversion and velocity across your pipeline
Per rep
Activity tracked against actual outcomes
Weighted
Revenue forecasting that updates as deals move
Scheduled
Reports delivered to your inbox automatically
The view a manager opens Monday
See what's working, who's producing, and where deals stall
Pull conversion by stage, activity by rep, and a weighted forecast onto one screen. When deals back up in underwriting at twice the normal rate, you see it before the month ends, not after.
- Filter every report by rep, team, source, or date range
- Period-over-period comparison on any metric
- Custom report builder with saved, scheduled views
The reports
No vanity metrics. The numbers that drive decisions.
Pipeline, activity, forecast, and team performance — each one tied to a decision a manager actually has to make.
Pipeline Reports
See deals by stage, conversion rates between stages, average time per stage, and pipeline velocity. Filter by rep, team, lead source, or time period. Know exactly where deals are and where they get stuck.

Pipeline reporting with stage conversion, velocity, stalled deals, and rep filters
Activity Reports
Track calls made, emails sent, texts delivered, tasks completed, and appointments set per rep and per team. Compare activity levels over time and correlate activity with results.

Activity reports across calls, SMS, email, tasks, and follow-up pace
Revenue Forecasting
Project future revenue based on pipeline value, stage probability, and historical close rates. Weighted forecasts adjust automatically as deals move through your pipeline.

Revenue forecasting with weighted pipeline, probability, and expected close dates
Team Performance Dashboards
Manager dashboards show every team member's activity, pipeline, and goal progress side by side. Identify top performers, spot reps who need support, and track team-wide trends.

Team performance dashboard with rep rankings, production, and coaching signals
Goal Completion Tracking
See real-time progress on individual and team goals. Track daily, weekly, and monthly targets. Historical goal data shows consistency and trends over time.

Goal management with progress tracking and streak visibility
Custom Report Builder
Build custom reports from any data in the CRM. Choose your dimensions, metrics, filters, and visualization type. Save and schedule reports for regular delivery to your inbox.

Custom report builder with saved views, fields, filters, and scheduled delivery
Reporting that holds up in a 1-on-1
1
Screen for pipeline, activity, and forecast
Real-time
Goal progress, no end-of-day reporting
Any field
Available to the custom report builder
60-day
Money-back guarantee, no contracts
Industry Examples
How Reporting works across industries
Every vertical gets purpose-built workflows and terminology. Here is what that looks like in practice.
Mortgage
A branch manager reviews a pipeline report showing that deals are stalling in underwriting at twice the normal rate this month. The activity report shows two LOs aren't following up on conditions, and revenue forecasting projects a shortfall if the trend continues.
Real Estate
A team leader checks the performance dashboard and sees that one agent has the highest number of leads but the lowest conversion to appointments. The activity report shows low call volume — a clear coaching opportunity.
Solar
A sales manager compares canvassing reports across territories and finds that one zone has 3x the appointment-set rate. The team shifts canvassing resources to similar neighborhoods, and revenue forecasting adjusts based on the new pipeline.
Insurance
An agency owner reviews retention reports and sees that auto-only households have a 30% higher lapse rate than multi-line households. This data drives a targeted cross-sell campaign for auto-only clients approaching renewal.
Frequently asked questions
Yes. Any saved report can be scheduled for daily, weekly, or monthly delivery via email. Choose the recipients and frequency, and the report arrives in their inbox with current data.
Custom reports can pull from contacts, deals, activities (calls, emails, SMS), tasks, goals, pipeline stages, and revenue. You can combine dimensions and metrics to answer specific questions about your business.
Yes. All reports support date range selection and period-over-period comparison. Compare this month to last month, this quarter to the same quarter last year, or any custom range.
Yes. Reports can be filtered by individual, team, role, or the entire organization. Reps see their own performance. Managers see their team. Owners see the whole company.
See the numbers that actually move revenue
Reserve early access with a 60-day money-back guarantee. No contracts.